How much revenue is generated from violations and fines?
FY2021 Actual: $979,648*
FY2022 Estimated: $1,567,437
FY2023 Budget: $1,880,924
*Covid Year
How much money is expended on parking enforcement and traffic control?
FY2021 Actual: $2,919,764*
FY2022 Estimated: $3,754,434
FY2023 Budget: $4,022,678
*Covid Year
What is the Parking Unit’s annual operating budget for expense, transfers, and capital?
FY 2023 Budgeted Expense: $22,835,684
FY 2023 Budgeted Debt Service: $8,137,084
What are the Parking Unit’s sources of income?
The Parking Unit of Transportation Services receives income (in order of importance) from permit sales, visitor parking, violations and fines and charging for services.
What percentage of the annual parking revenue is made up of citation fines versus permit and event charges?
59% permits, 34% Visitor parking & events, 6% citations
What is the Transit Unit’s annual operating budget for expense and transfers?
FY 2023 Budgeted Expense: $10,532,838
FY 2023 Budgeted Debt Service: $1,059,839
What are the Transit Unit’s sources of income?
The Transit Unit of Transportation Services receives allocations from the University Advancement Fee and charter services.
What is the total amount borrowed for capital improvements since 1988?
Total debt incurred for capital improvements are as follows:
Long term payable bonds
FY2022: $70,528,700
Commercial paper payable: $10,800,000
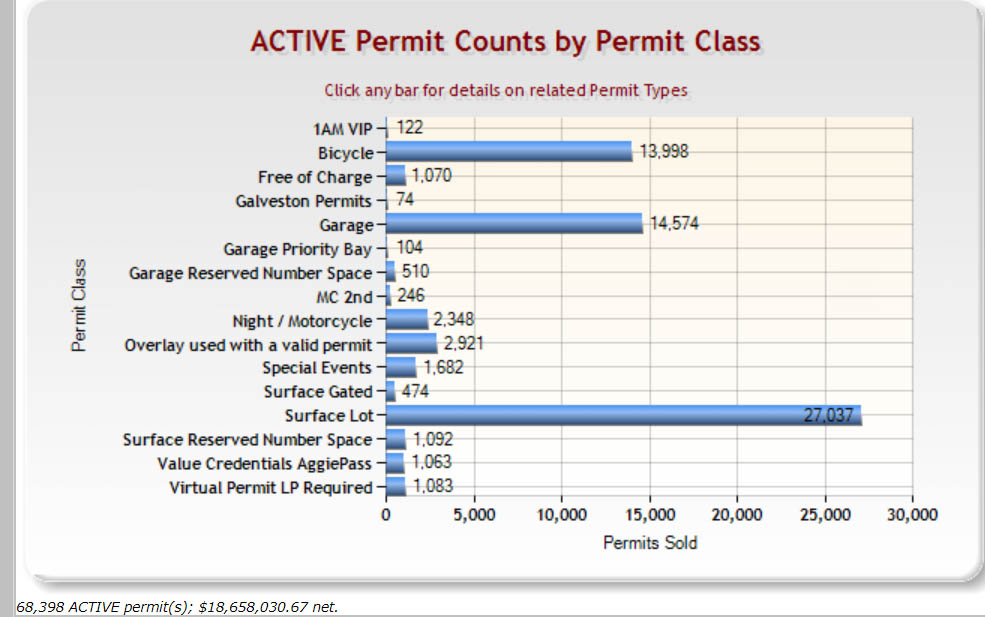
How many of each type of permit is sold and how much revenue are these estimated to generate?
Snapshot as of Spring 2022